The Yamuna was considered a nurturing and life-enhancing goddess in the past. Legend has it that bathing in the sacred waters of the Yamuna, the sister of Yama, the god of death, frees one from the ordeal of death. The 1376-km river is a tributary of the Ganga and originates in the Yamunotri glacier in the lower Himalayas. It passes through several states in north India including Uttarakhand, Haryana, Uttar Pradesh and Delhi where the river was once its lifeline. Its water has been diverted about 200 km upstream of Delhi at Hathnikund barrage through the western and eastern Yamuna canals for irrigated agriculture while wastes from 50,000 industries and sewage from eight million people tear the natural system asunder.
At Delhi’s Nigambodh ghat located on the banks of the Yamuna, one can see a series of bathing and ceremonial stepped piers leading to the waters of the river. River enthusiasts, activists and researchers have assembled there for a curated walk along the Yamuna and a boat ride with “sensors”. The river has been abused so much over time that it symbolises death in its 22-km stretch through Delhi today. “It is mid-April, and we are lucky that the river has not been reduced to a sludgy stretch, which it normally is at this time of the year,” says Himank Sharma, who has been working on the Water-to-Cloud project on the Yamuna.
Sensor reveals dismal state of river
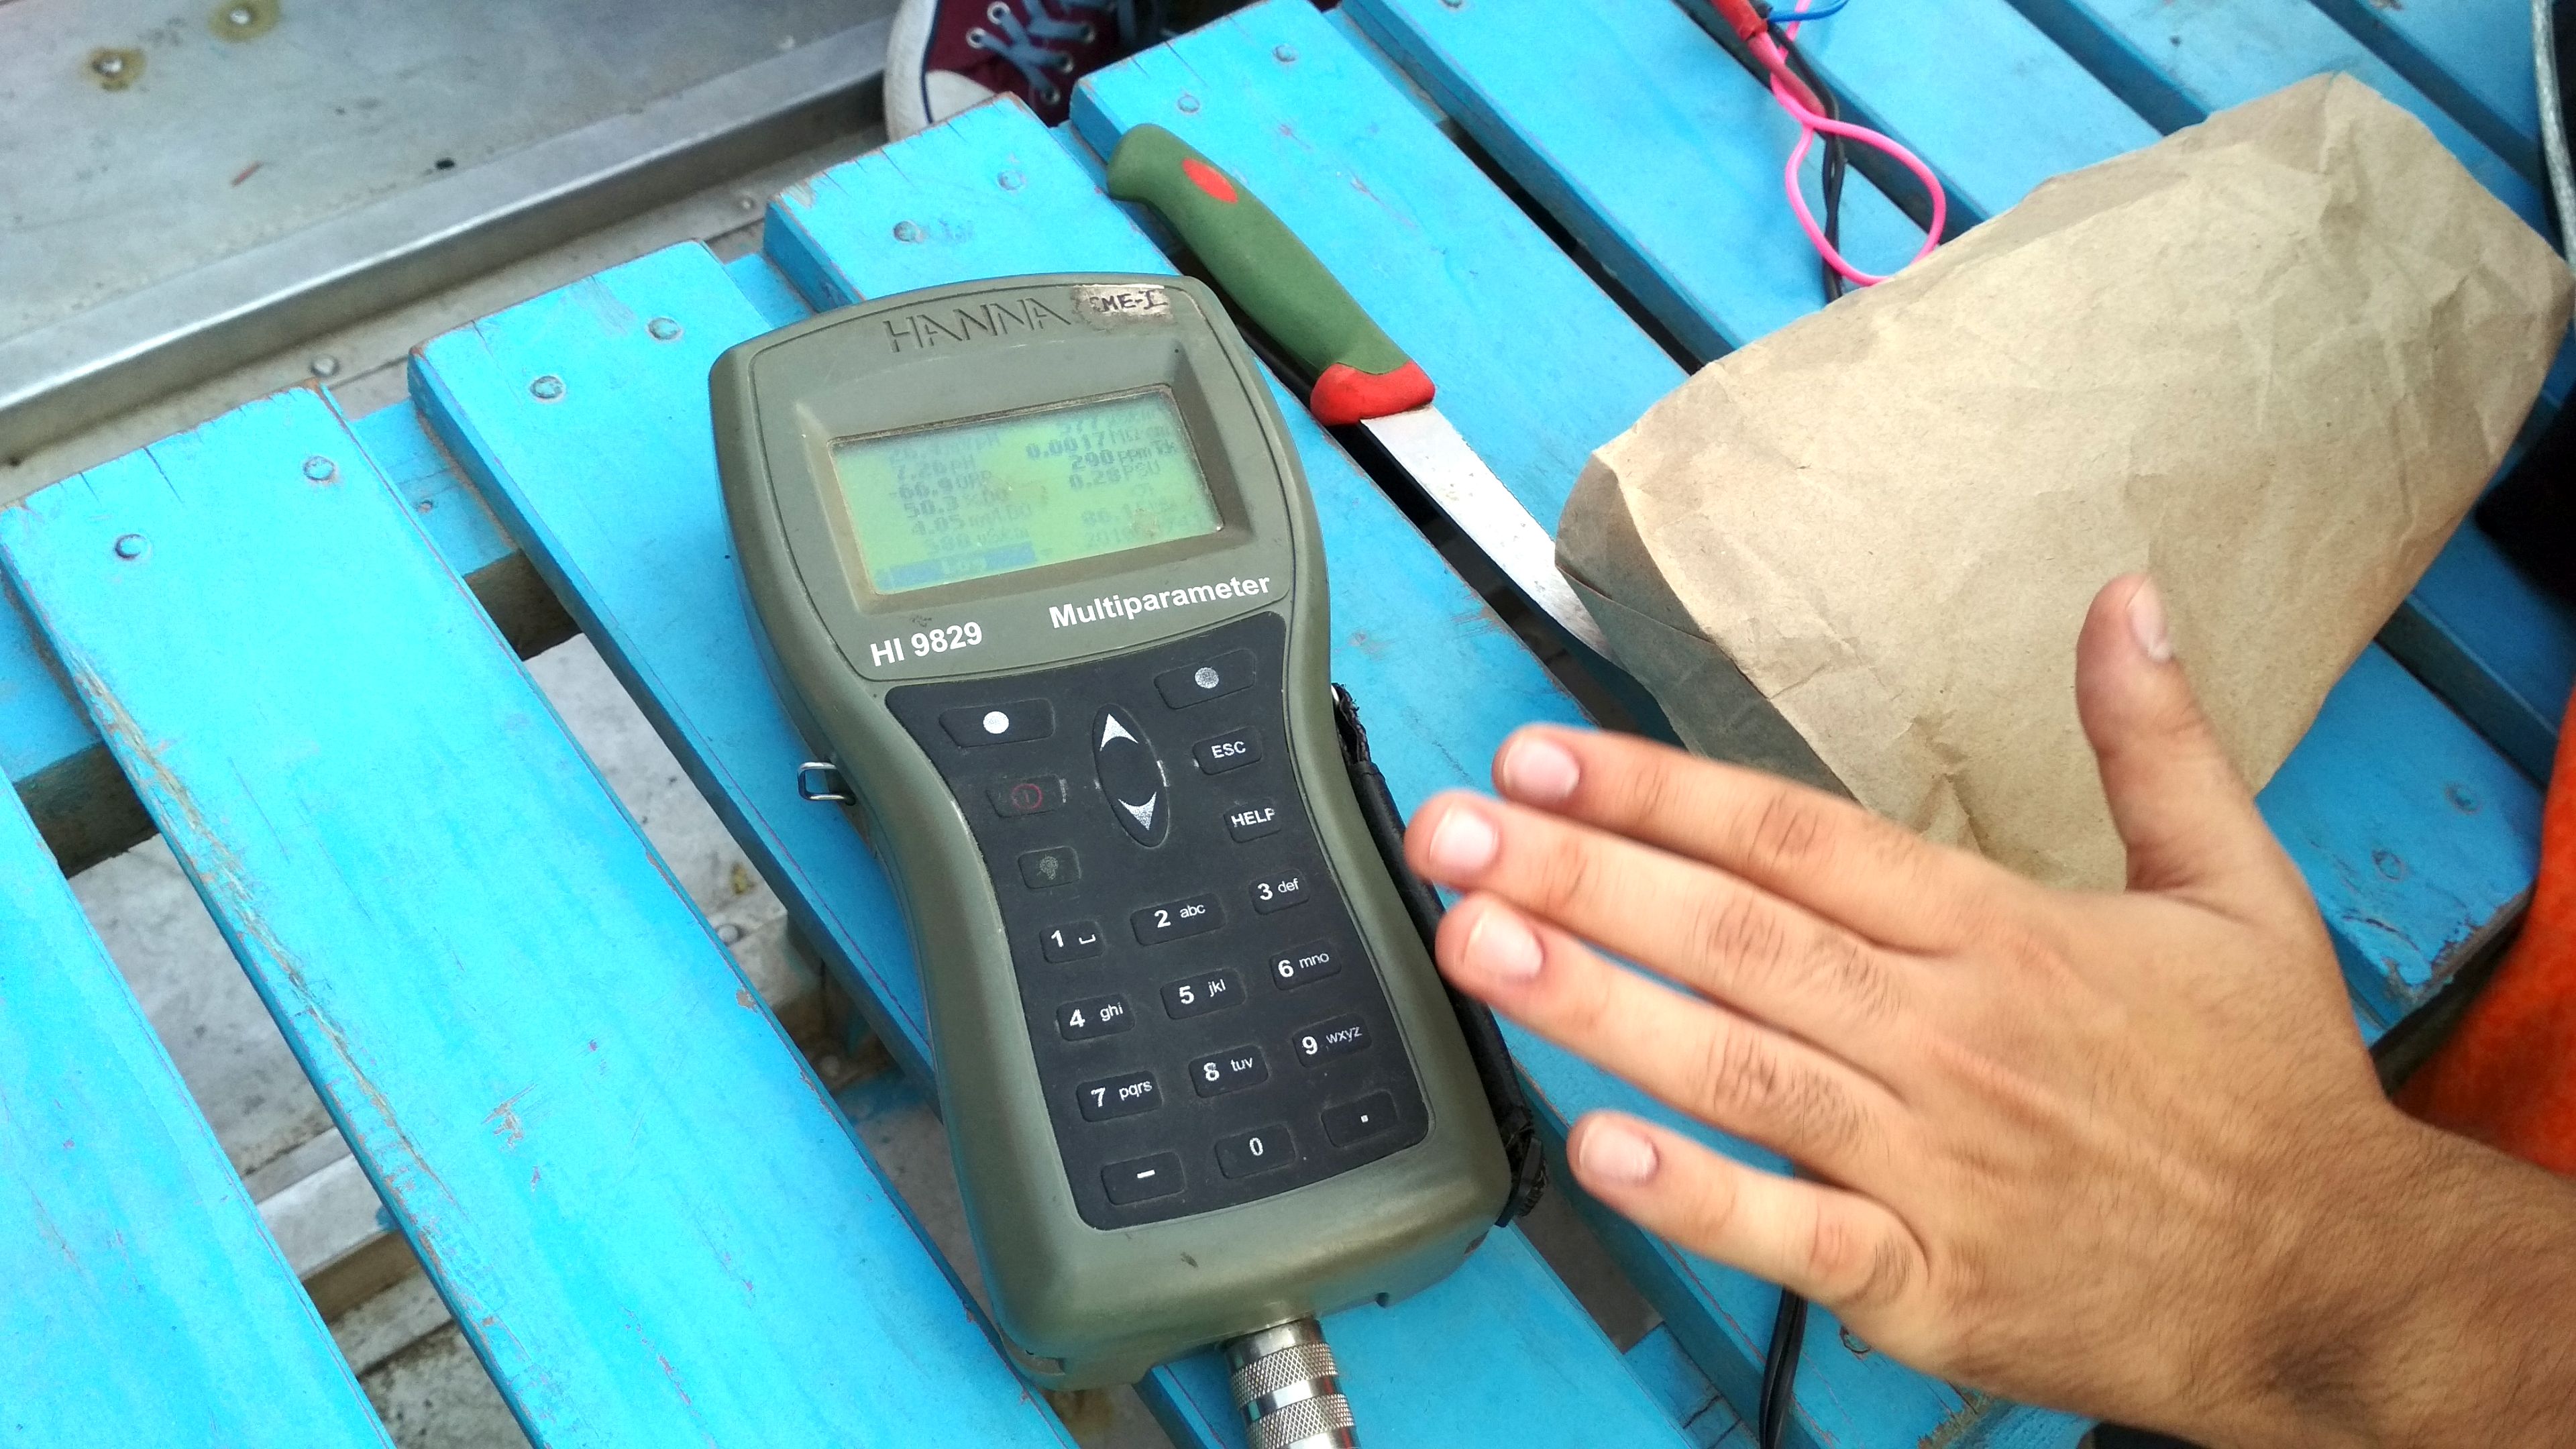
The project, conceptualised by a team of researchers from the University of Chicago, US helps demonstrate that scalable water quality mapping systems can detect and predict water contamination. We are taken on a boat equipped with multiple submersible automated sensors to gather data. The boat sets on a sail at different times of the day on a predefined route. “The sensor measures parameters of interest such as temperature, electrical conductivity, pH, dissolved oxygen, biochemical oxygen demand and turbidity using thermometric, electrometric and turbidimetric techniques. These parameters are measured in-situ using the real-time data logging sensors and the data is made public at the project website,” says Sharma.
The dissolved oxygen levels or the amount of oxygen dissolved in water in this stretch has severely depleted due to high levels of organic content in the water. It ought to be a minimum of five mg/litre, but there is nearly no dissolved oxygen (DO) in any stretch of Yamuna downstream of Wazirabad to Okhla barrage. The performance of the sewage treatment plants has been dismal and the biochemical oxygen demand (BOD) or the amount of dissolved oxygen needed for microorganisms to breakdown the organic matter in water has not met the standard of being upto three mg/litre. This indicator of water pollution is very high. Total coliform and faecal coliform, which are crucial parameters to gauge the biological contaminants present in water, too show very high values.

Maps to monitor polluted stretches
“This time-stamped and geo-tagged data is filtered and superimposed on geospatial maps to create two-dimensional area heat maps for ease of interpretation and predictive analysis,” says Subhojit Goswami, manager, Communications and Outreach for the project. These easy-to-interpret heat maps are intuitive and can help even laypersons decide which polluted stretches of the river they should avoid. To support the in-situ field measurements, detailed lab analysis is done on a regular basis. The project applies mathematical tools to predict the spread of pollution, interpolate sparse data, and identify specific sources of pollution.
“The damming of the river has altered it completely making it tiny, fragile and strewn with trash. The river’s health is dismal and it is heavily polluted, and is without continuous flow for nine months of the year,” says Bhim Singh Rawat, a river conservationist who is associated with SANDRP, a Delhi-based NGO. Even the Delhi Pollution Control Committee admits that the 22-km stretch from Wazirabad to Okhla, which is less than two percent of the river length from Yamunotri to Allahabad, accounts for about 76 percent of the pollution level in the river.
“The water quality of Yamuna could be bettered by augmenting its flow and treating wastewater from municipal and industrial outlets, which adversely affects water quality,” says Sushmita Sinha of Local Feedback, a start-up working on urban development.
The Water-to-Cloud project shows the importance of detecting river pollutants and locating pollution sources accurately. There is a lack of real-time monitoring of Yamuna so far. In 2018, the Delhi Pollution Control Committee had recommended a mechanism to be worked out jointly with the Central Pollution Control Board to install an online system for quality testing of water in the Yamuna at Palla and Wazirabad.
“A continuous, real-time, and in-situ water quality would not only measure standard parameters but also ammonia because this is brought up as a recurrent problem which impacts drinking water supply to Delhi. Time-stamped, and geo-tagged data through in-situ measurements as done by the Water-to-Cloud project can reveal the full picture of complex pollutants in the Yamuna,” says Sharma. The project has done the groundwork for developing a scalable, low-cost real-time sensing network using mobile sensing platforms to obtain high frequency temporally and spatially varying water quality data.


