- Brought to you by Arghyam

From: 2001, Till (Change Date):

Money Spent

Context: The rural sanitation scheme allocates funds for different sanitation activities in villages. The main activities supported include:

    1). Construction of toilets - for individual households, public toilets and toilets for institutions such as schools and creches

    2). money for improving awareness on the need for toilets

    3). creating a supply chain for manufacturing toilet-ware and

    4). waste management efforts

Using the visualisation: Use the drop down to toggle between spending on various components. Spending of each district is denoted by a corresponding circle.

    1). Size of the circle indicates budget set aside for that component

    2). Colour of the circle indicates how much the state / union territory has spent on rural sanitation when compared to what was planned. Greener the colour, better the spending.

Toilets Built

Context: The rural sanitation scheme promotes the construction of toilets in households, schools and nursery schools. These visuals will provide an understanding of how well the scheme is building toilets in rural areas.

Using the visualisation: Use the drop down to toggle between toilets built for households, schools and anganwadis (nursery schools). Construction in each district is denoted by a corresponding circle.

    1). Size of the circle indicates number of toilets to be constructed

    2). Colour of the circle indicates achievement of construction by the state / union territory. Greener the colour, better the construction.

Performance

Context: This visualisation compares spending on the rural sanitation scheme with construction of toilets for rural poor houses. Ideally, every district should fall on the linear trendline meaning that it spent a proportionate amount to how many toilets were constructed. Being off that line means that the state has either under-spent or overspent to build the same number of toilets.

Using the visualization: Each circle represents one State / Union Territory. Click on a State or select from the drop down for the State and District that you want to see. The size of the circle represents rural poor toilets required. The x-axis is based on overall spending on rural sanitation (since toilet construction for the rural poor and allied activities is the biggest spend in the whole allotted sum). The y-axis is based on % toilets constructed for rural poor households. If the circle lies in the green part of thae graph - that means that the respective district is doing well, if it lies in the red part then it is not.

Census

Context: When the 2011 Census data was published and asked about latrine owndership several states were in for a surprise as the numbers were completely different from the numbers that were being reported to the Ministry of Drinking Water and Sanitation's IMIS. Accountability Initiative looks at these numbers and analyses them for each state/ union territory. A full report can be accessed here.


Download: full dataset | Glossary of terms
Columns used:

Source:


Ministry of Water & Sanitation

Nirmal Bharat Abhiyan: Trends

Open defecation in rural india remains a problem that perplexes policy makers. The first, government level initiative to tackle it came in the form of the Central Rural Sanitation Programme in 1986. A subsidy driven approach was adopted. This programme morphed to take into account the necessity to educate and empower people to adopt and use toilets - the Total Sanitation Campaign in 1999 and to adopt a panchayat based approach rather than a household based one - the Nirmal Bharat Abhiyan in 2012. The scheme was allotted Rs. 3500 crores in 2012-13 budget (before revision) and around 27 lakh toilets were constructed last year.

The Ministry of Drinking Water and Sanitation, Government of India, under which this scheme is housed puts out detailed financial and physical progress data. This is supposed to provide anyone who is interested a snapshot of the rural sanitation situation in the country. This was also a large scale attempt to decentralise data collection as districts enter data into the IMIS on the government website directly. What has resulted is a vast collection of cumulative data from 2001 on the status of sanitation, available up to the habitation level.

This effort by the government to put data proactively on the website must provide much reason to rejoice. However, several concerns remain about the quality of the data that is available. The latest numbers that challenge the MDWS data come from the census, according to which around 3.5 crore toilets are missing.

Arghyam is a public charitable foundation set up by Rohini Nilekani in 2005 - Safe, sustainable water for all. One of our key focus areas is looking at government spends on sanitation - from both the qualitative aspects of data that is present on the website and also the implementation of the government's scheme.

To answer questions about data, Arghyam is collaborating with Gramener. The aim of this collaboration is to understand the sanitation data better & help open up the data actually.

As a first step we are taking data off of the website and analysing it to understand it better. These analyses - as stories accompanied by visualisations will be uploaded periodically here.

Rural sanitation scheme - progress & performance

We can find out how the rural sanitation scheme is doing because of the data that is published on the Ministry of the Drinking Water and Sanitation website. This project aims to create simple tools that will demystify the large datasets and compare it to other relevant datasets.
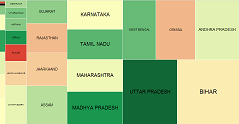
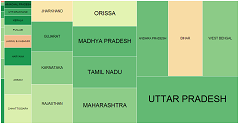
Money spent

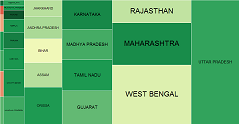
Total money spent on rural sanitation

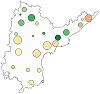
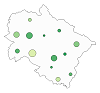
How much money has each state spent on the rural sanitation scheme?

Money spent

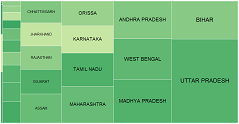
Spending on Rural Sanitation

What is the spending on the various components of rural sanitation?
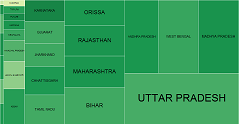
Money spent

Money Spent on building toilets for the Rural Poor

How have the incentives been given for toilet construction?

Money spent

Money spent on sanitation coverage of rural schools

How effectively has money allotted for providing sanitation in rural schools been spent?

Money spent

Money spent on sanitation coverage of rural nursery schools

Is the spending on track for rural nursery schools (anganwadis)?

Money spent

Money Given vs Money Spent

What is the contribution of the state, centre and people towards toilet construction?
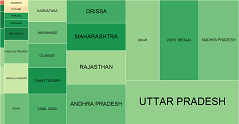
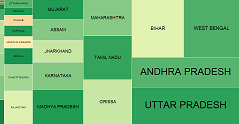
Toilets built

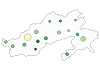
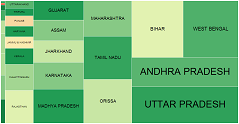
Total sanitation coverage

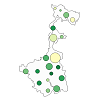
How many toilets has rural India constructed?

Toilets built

Evaluation of toilets built for the rural poor

How many toilets were built for rural poor households? Have targets been met?
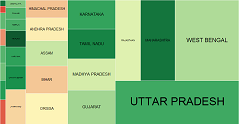
Toilets built

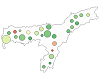
Coverage of toilets Rural households

How does toilet coverage compare with total rural households as per census 2011?

Toilets built

Toilets built for Schools

This is critical because it helps inculcate sanitation habits from childhood. Has toilet construction kept pace with targets?

Toilets built

Toilets built for Nursery Schools

Nursery schools are important to prevent child malnutrition and hunger. Have we been able to provide them with toilets?

Toilets built

Toilets built for the rural poor - data.gov.in

MDWS data on rural poor toilet coverage on opendata.gov.in

Performance

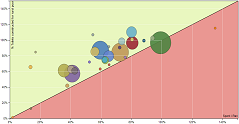
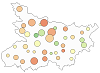
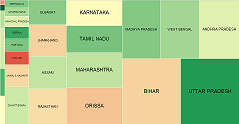
Comparing spending to toilet construction

How do toilet construction and spending on toilet construction compare?

Performance

Toilet coverage Census 2001 - 2011

Changes in rural toilet coverage over the decade - Census 2001 to 2011.
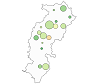
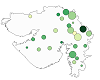
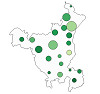
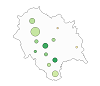
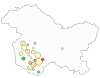
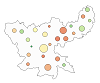
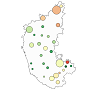
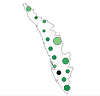
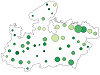
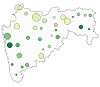
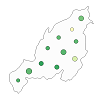
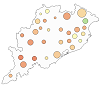
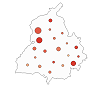
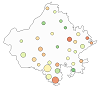
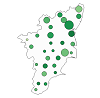
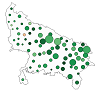
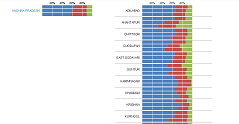
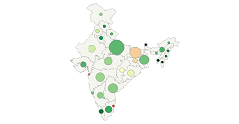
State Profiles

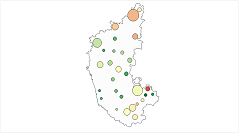
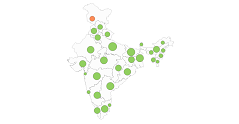
State performance in rural sanitation

Find out how your state is doing in rural sanitation.

Data Change

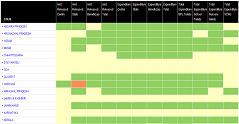
Changes to data entry

Have the states entered data into the IMIS this month?

For more queries and feedback please contact us: click here