


Total population of these villages vary considerably and most of the villages have population ranging between 1200 to 4000 persons as depicted by green and light green tones, respectively. Few villages have population over 4000 or below 1200 and very few have population even below 600.
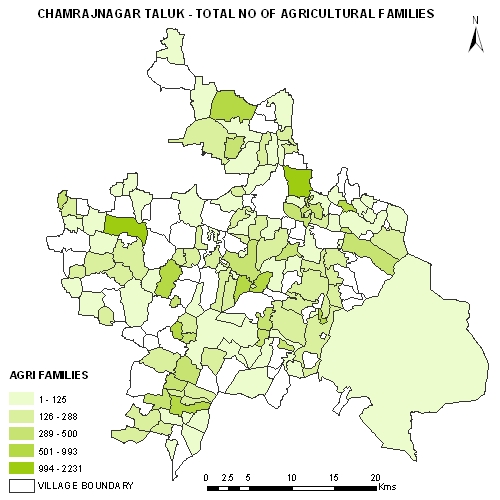
The map indicates that majority of the villages seem to have agricultural families ranging up to three hundered. Also, the number of agricultural families vary from very few to very large in the district.

Total cultivable area in most of the villages ranges between 240 to 750 ha. It can be observed, that some of the villages also have cultivable area more than 1200 ha.

Number of wells in a village suggest about type and extent of water resource development in an area. This map depicts that majority of the villages appear to have less than 48 wells within their village boundaries and very few seem to have number of wells more than 200.

Water supply in most villages per capita per day is less than 60 liters. Fewer villages have water supply above 60 lpcd but in many villages the supply is even less than 10 lpcd.

This overlay map puts two parameters together i.e. total number of agricultural families vs total cultivable area in ha. The map shows that higher number of agricultural families are in the villages which have highest cultivable area, as depicted by big red bars. On the other hand, in villages having cultivable area less than 241 ha red bars are completely missing which shows a positive correlation between the two parameters. But in villages with cultivable area between 242 to 1219 ha show varied trends as depicted by different lengths of red bar, thus indicating a weak correlation.

This is another overlay map depicting total population in villages of Chamrajanagar taluk and water supply in litres per capita per day (lpcd). In some of the villages with high population levels i.e. over 4000, per capita availability of water is high whereas in other villages having population below 4000, the water availability is quite low irrespective of the population in the village.


