Tips for working with spreadsheets

Spreadsheets are ubiquitous and a popular choice for data entry. Here are some tips to use them effectively and to avoid common mistakes.
8 Dec 2013
0 mins read
Working with spreadsheets

Introduction

This article is the third in the series of posts from the Data Capacity Project collaboration with Keystone Foundation. It is also the first in the series that will be offering tips on working with data. 

Almost every organisation working in the development sector has at some time or another, conducted a data collection exercise. It usually starts with developing 'formats' or surveys and then filling them up through interviews, discussions, and/or observations. Sometimes we also get secondary data, such as demographic data or rainfall data that we need to enter into a computer file for archiving, and/or printing out. All organizations have to go through this process and there are common practices that are prevalent but are not the best way to manage data. In this series of articles we examine the typical use cases and ways to avoid common errors and techniques to improve the quality of our work.

When one has to enter some data, say from a field survey format, one usually opens a spreadsheet (MS Excel, Libreoffice Calc etc.) and creates columns just as they are in the hard copy format. In some cases, people even use a word processor (MS Word, Libreoffice Writer etc.) and create tables for entering data. The common tendency is to create a file where the data is easily entered by referring to the hard copy formats. It is rarely seen as worthwhile to make sure you can access and use the data later, that bridge is often crossed when the time comes! There are a number of factors here that can cause trouble when trying to analyse data. Given below are some Dos and Don'ts with regard to working on a dataset in a spreadsheet.

DO:

  1. Always save the empty file or copy of a template, if any, before you start entering data. Save files with meaningful names and version number either as 1.0, 2.0 etc. or with date modified. This would ensure that when getting back to the files after a period of time, you don't have trouble figuring out which file is the latest.
  2. Keep different types of data in different columns. E.g. Date and location;

 Wrong method

Location and year of observation

Bangalore, 2010

Chennai, 2009


Correct Method

Location of observation

Year of observation

Bangalore

2010

Chennai

2009


  1. Sometimes the same question might have more than one answer, E.g. For the field 'Fertilisers used', the response might be NPK, DAP, Urea. Decide how this should be handled – separate rows for each one, all in one row separated by commas or a separate table for this. This would depend on how you would like to analyse the data.

Option 1 – Simplest to enter, but difficult to group farmers by particular fertilisers used.

Farmer ID

Fertilisers Used

1

NPK, DAP, Urea

2

NPK, DAP

3


Option 2 – Works when the number of alternatives are few, E.g. only three fertilisers.

Farmer ID

Fertiliser Used 1

Fertiliser Used 2

Fertiliser Used 3

1

NPK

DAP

Urea

2

NPK

DAP

None

3

None

None

None


Option 3 - Works when the number of alternatives are few, E.g. only three fertilisers.

Farmer ID

NPK Used

DAP Used

Urea Used

1

Y

Y

Y

2

Y

Y

N

3

N

N

N


Option 4 – Works better when a database rather than a spreadsheet is being used. Fertilisers used can then be a separate table linked by Farmer ID to other tables.

Farmer ID

Fertiliser Used

1

NPK

1

DAP

1

Urea

2

NPK

2

DAP

3

None


  1. Always mention the unit of measurement in the column name. E.g. Area_ha or Annual_Rainfall_mm. For units, use standard abbreviations.

Wrong method

Area

Ha


Correct Method

Area_ha


  1. While recording data, note the units in which the respondent is stating and separately convert it to a common unit of measurement. E.g. If the respondent states landholding as 10 cents, then note it down as such. While entering in the system it may be converted to acres or any other unit. This would avoid mistakes being made in recording data when we try to convert the units on the fly. In some cases the same unit (E.g. Bigha for land area) has different values in different areas. Explicitly state the conversion in the table while recording the data so that it can be verified.

Farmer ID

Landholding_bigha

Landholding_acres

1

5

1

2

10

2


  1. Use a drop down or autocomplete option to enter repetitive text so that spelling mistakes can be avoided. This would ensure that while analyzing the data, the results are accurate and standardised. E.g. If we are entering the names of villages and other details, and the same village name appears with different spellings, then sorting as well as subtotals would not work properly. An easy way to get a drop down is shown in the attached annexure_examples.ods file. Alternately right clicking on a cell provides an option to select from a drop down.
  1. When using short names for column headings, use a separate sheet to give the full name of each column heading and the units, if any so that others can easily understand the dataset. E.g. well_depth_m may be the column name. The description should be 'Depth of water in the open well measured in meters'.
  1. When storing data such as dates, select appropriate data type for the cell. Otherwise some of the data entered might change into another form. E.g. Dates entered into a cell in the spreadsheet might be converted into a number and may not remain in the form that it was entered in. E.g. 1 January 2013 changes into 01/01/2013 in Calc and into 01-jan-2013 in excel. These may vary depending on the settings, but in general it should be noted that particularly for date fields, it is better to choose a predefined format in the cell properties before entering the data.
  1. Enter the column headings in one cell only for each column. Headings in more than one row would make operations such as sorting and filtering troublesome.

Wrong method

Area

Ha


Correct Method

Area_ha


  1. Always give references to cells in formulae instead of writing numbers directly into the cells. E.g. See attached file under tab 'formula'.
  1. Always backup the file with the raw data entered and use a copy for any further workings. This would insure you don't accidentally delete or change data.
  1. Quite often the data contains some fields that are names of places or people where standardisation of spellings may be difficult. In such cases, it is better to provide Unique IDs to them to minimize problems with standardizing names. E.g. See attached file under tab 'standardising'.
  1. Apart from the data itself, there is another set of data called ‘metadata’ that describes the dataset. This could include the context in which the data was collected, by whom, when and where etc. It is important that this metadata is also described in the same document so that as a standalone document it is fully described.

DON'T:

  1. Do not work for any length of time on a file without saving the file periodically. Either get into the habit of saving the file manually or enable the autosave option.
  1. Do not use merge cells option. This is useful only if you are typing up a table for printing it out. It will make the handling and analysis of the data troublesome. In case there are two or more fields/columns that have the same heading and different subheadings then repeat the heading name as prefix in the column name. E.g.

Wrong method 1

Water level (ft)

Pre-monsoon

Post-monsoon


Correct method 1

water_level_pre_monsoon_ft

water_level_post_monsoon_ft
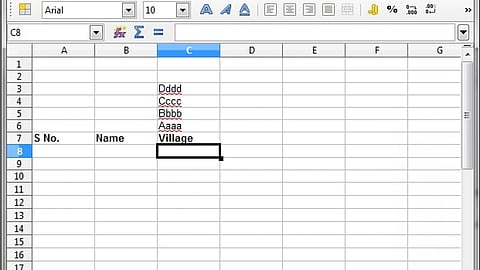


Wrong method 2

Farmer ID

Village_name

1

A

2

B

3

C

4

D

5

6


Correct Method 2

Farmer ID

Village_name

1

A

2

B

3

C

4

D

5

D

6

D


  1. Do not calculate numbers and directly enter the values in a cell. Write each of the numbers involved in the calculation as a separate field and then use the cells in a formula to arrive at the value. This will ensure that others can easily understand the table and verify the calculation(s). This will also make it easier to update the values in case one of the numbers is changed. E.g. See attached file under tab 'formula'.
  1. Do not use colours or any other formatting to denote any additional information about the data. E.g. Yellow highlights mean data needs to be checked or red ones are to be deleted. Instead add a column and write the status/action to be taken there. This would be transparent to other users and also ensure that this data is not lost when moving to another format or software. E.g. See attached file under tab 'colour'.
  1. Do not insert empty rows between two lines of data or columns to make it look better. This will make it difficult to analyse the data.
  1. Do not copy paste the heading row for each page in order to get print outs with page headers. Instead go to 'Format -> Print Ranges -> Edit -> Rows to repeat' and choose the row with the headings. This will ensure that the header row appears on top of each page in the print out.
  1. Do not use fancy formatted headings including use of vertical fonts etc. These are only visual elements and as such do not help with the data analysis.
  1. Do not distribute the same data throughout different sheets, even if collected by separate offices. Try to merge them so that one master data sheet exists for each type of data.
  1. Do not distribute data across different sheets where only the sheet name differentiates the data sets. E.g. One sheet with district level data and another for just block level data, then sheets with district names and data of all blocks from that district will be in a different sheet and can't be compared. Instead add a column called district to the tables and merge them into one sheet.
Posted by
Attachment
Get the latest news on water, straight to your inbox
Subscribe Now
Continue reading