- Topics
- Feature
- Opportunities & Events
- About
- Hindi Portal
- Data
- Topics
- Feature
- Opportunities & Events
- About
- Hindi Portal
- Data
Daily rainfall information at a weather station level is very useful data. It can be used for analysis and planning. A district average can't help people plan or monitor a situation in a real time manner. It is possible to aggregate up for trends but deaggrating is impossible especially for places like Uttarakhand where the climate can change drastically from one area to the other.
Last year, David Hopkins, who compiles daily weather readings from his weather station in Uttarakhand, shared an amazing dataset with us. We were already on the lookout for more sources of rainfall data, that was more granular than the monthly averages that the IMD provides. We also had Rajasthan's daily rainfall and some data from IMD's automatic weather stations.
The Uttarakhand floods last year highlighted the need to look at the shortfalls of only analysing aggregated rainfall data. It would be useful for the IMD to share the daily rainfall data at the weather station level in a more open and accessible way. This will help many people in the sector with planning water management projects from rain water harvesting to groundwater management.
In our analysis, we have showcased the major problems with district and monthly data, especially for a place like Uttarkhand where the mountains create a lot of different climates. Multiple weather stations are needed to really get information for the different areas.
A look at the 2002 chart displays clearly the outliers and rain intense days (the blue bars). The entire blue area gives the aggregate annual rainfall for the year 2002, according to David Hopkins' measurement (for Kausani), while the entire gray area gives the aggregate annual rainfall for the year concerned according to IMD's measurement (for the District of Almora). The district average does not represent what is happening in Kausani, as seen in graph above.

With the average rainfall data, one can't get a sense of that change!
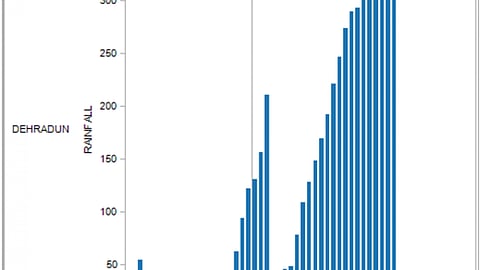
To get a sense of Uttarakhand floods, we looked at last June's rainfall data.The IMD has not put up the 2013 monthly averages yet. So we used the daily hourly data from the IMD Automatic Weather stations. Even though the automatic weather station data is available, it is only archived for 2 weeks which makes it difficult to download a large amount of data. Also there are gaps in where the weather stations are.
The graph shows the hourly data that the Dehradun weather station reported on June 15th, 16th and 17th.
One can see very clearly when the bulk of the rain is falling and when the cloudburst happened. For understanding floods, this is much more useful than the weekly average and definitely more useful than the monthly/district average.
The IMD collects an incredible amount of useful information, and while it is good that they do some amount of proactive disclosure, it would be even more useful if they left real time, weather station-level data open so people everywhere can better utilize it.