India’s mapping activity dates back to the Indus Valley Civilization (c. 2500–1900 BCE) as per the famous geographer, Joseph E. Schwartzberg. His work is based on a couple of surveying instruments and measuring rods that were excavated from the Indus valley sites. Our mapping traditions were influenced by Vedic, Tibetan, Islamic and more recently, British cartography. One of the earliest maps of India is of the confluence of the Ganges and the Yamuna and is available as a wall sculpture in Udayagiri, Vidisha, Madhya Pradesh. It dates back to the Gupta empire in the 5th century.
India’s first modern maps were produced by the premier national survey and mapping organization of India, the Survey of India, in 1767. We have come a long way since then with the advent of modern mapping techniques like satellite imageries. While atlas cartography was prevalent in the country, according to Prithvish Nag and Smita Sengupta in 'Geographical Information System Concepts and Business Opportunities', "the Fifth Plan 1974-1979 marked a watershed in the history of thematic cartography in the country".
The National Atlas and Thematic Mapping Organisation (NATMO) began mapping land and water resources during the eighties, when satellite imageries, particularly from Landsat, became available. Several atlases depicting the vital resources of the country came up at this time. The user base that wanted thematic maps like those on water resources for precise applications also began growing during this time. P Nag the then Director of NATMO says that the “changing scenario of resources through time and space is a matter of great importance for spatial development of the country”.
Water resource atlas of India
The water resource atlas contains information collected from several sources. It portrays a reasonably full depiction of the status of water resources in the various agro-climatic regions of the country. It comprises 33 plates that display a broad range of information related to water resources of the country.
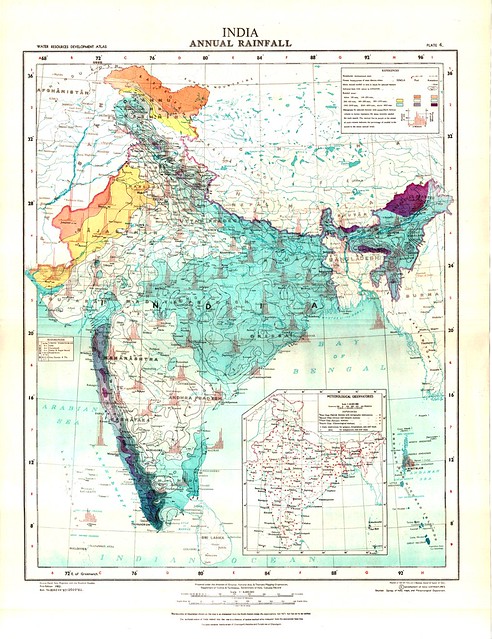
This atlas begins with an introductory plate dealing with the administrative divisions of India, viz., states, union territories, district and tahsils and taluks with their headquarters. The detailed physiographic regions of India are delineated on the second plate while the third, fourth, fifth and twelfth plates deal with the spatial patterns of climatic conditions and variation of rainfall.
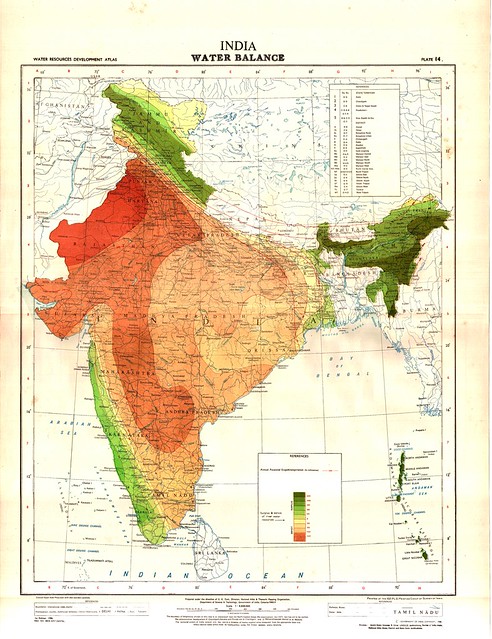
The sixth, seventh, eighth and ninth plate portray the soil texture, land use conditions, density of rural population and livestock distribution respectively. Plates ten, eleven, thirteen and fourteen deal with drought areas, detailed river basins of India, surface run-off condition and water balance analysis. Plates fifteen to thirty two depict the spatial distribution of water resources, on a scale of 1: 1,000,000.
These maps based on the meticulous plotting of the entire water resources of the country, unfurl the pattern of water distribution at a regional level. The pattern, character, texture, alignment, behavior and utilization of the streams, lakes and other water resources are indicated on these maps. These are very useful in planning at national, regional and local levels. More so, in the event of droughts and floods when strategies need to be prepared. The availability of groundwater resource is also depicted in the last plate (plate 33).
Mapping has been done mostly on three scales as per the needs related to data analysis, precision as well as visual appeal. Plates one to fourteen are drawn on a scale of 1:6,000,000, while the rest, on a scale of 1: 1,000,000. Apart from this there is a plate with a set of four maps showing seasonal rainfall and livestock in the scale of 1: 12,000,000.
Land resource atlas of India
Of all the resources, land is of particular significance as our economy is largely land-based. It is therefore important to know the capabilities and potential of this resource across the various regions of the country, through land-based mapping. The land resource atlas published by NATMO in 1996 comprises twelve multi-coloured plates each indicating a specialized theme related to land resources at a scale of 1:60,00,000, with insets at the scale of 1:180,00,000 wherever required. These maps have been supplemented with analytical notes and statistical tables. The general information pertaining to the administrative set up of the country is provided in the first plate.
Plate two deals with the physiographic features, which decide the availability of the resources to a great extent. Plate three portrays the drainage networks for purposes of irrigation, navigation, power generation, urbanization and industrialization. Plate four deals with the climatic conditions, which govern the agronomic set up of the country. Plate five deals with the soil while plate six pertains to rocks and minerals that have a great bearing on the industries.
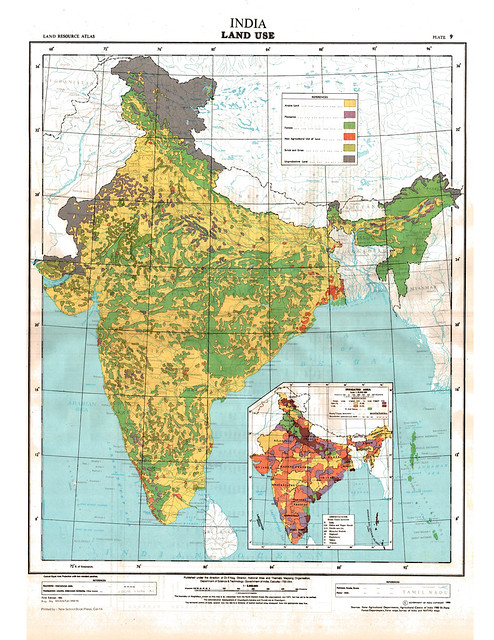
Plate seven is related to forests, which play an important role in the life, economy and habitat of the country. Plate eight deals with land capability, a parameter that evaluates the potential of soils for optimal land use. The current status of the varied use of our vast land resources is highlighted in plate nine. Plates ten and evelen deal with the possible crop combination zones and crop association along with types of farming for systematic planning for agricultural development for the country. The last plate deals with the status of land resources of the country and attempts to present a generalized picture of complete resources in various parts of the country.
View both the land resource atlas and the water resource development atlas.


